- Playing For Doubles
- Posts
- How To Bet Against Parabolic Stocks
How To Bet Against Parabolic Stocks
My Four-Step Framework (With 10 Case Studies Inside)
Ahmad Jivraj
January 05, 2026
First off, I wish you a very Happy New Year!
Here is my gift to you, to start off your 2026.
Here’s what I can say, with near-certainty, about parabolic advances:
Vertical moves aren’t sustainable
We can’t predict exactly when they’ll end
But when tops do come, the ensuing selloffs are almost always brutal
The question isn’t whether a parabolic stock will crash. But rather, when?
Can we profit from this?
I believe so.
After studying many, many, parabolic tops across 50+ years of market history, I’ve identified a topping pattern that repeats with remarkable consistency.
Let me walk you through the pattern and several examples.
My 4-Phase Framework For Betting on Parabolic Reversals
Phase 1: The Parabolic Advance
This is the easiest phase to identify: It is visually obvious in the chart.
Current Example: It’s pretty clear Silver has gone parabolic.

Phase 2: The Top
This is where it gets hard.
The problem with parabolic advances is that because of the imbalance of buyers and sellers, the accelerating price momentum can create moves that far exceed anything expected.
As a result, tops are clear only in hindsight.
That said,
I’ve found that waiting for a weekly close below the 18 week exponential moving average (the purple line in our charts) is a great way to identify a top. It has a very good hit rate. Once the weekly price closes below the purple line, the high right before tends to mark the top.
Phase 3: The Recovery Rally
After the initial sell-off, when the weekly closing price is finally below the 18-week moving average, the market often finds itself “over-sold” and it is not uncommon to then experience a recovery rally.
It is this recovery phase that can present the entry point we’ve been waiting for.
Phase 4: The Catalyst That Triggers The Real Selloff
The catalyst we are looking for is when the market hits resistance and turns back down.
One such catalyst is when the 8-week moving average (the teal line in our charts) crosses below the 18-week moving average.
Now that we know the framework and what patterns to look for, let’s look at a few examples.
Historical Case Studies: The Framework in Action
Example 1: The Infamous Nasdaq 2000 Crash
Phase 1: The Parabolic Advance
By March 2000, the Nasdaq had doubled from its October 1998 lows. Analysts predicted even higher levels. Sound familiar?
If you looked at the chart, it was obviously parabolic.
Phase 2: Identifying the Top
Looking at the chart below, we can see that during the parabolic advance, at no point did the weekly price close below the purple line (the 18-week exponential moving average). Until the week of April 10, 2000 (the big red candle).
Once that happened, looking back, we can see that the top happened just 3-4 weeks earlier.
Phase 3: The Recovery
After the initial selloff breached the 18-week MA, the market was “oversold.”
A 4-month recovery rally followed.
Phase 4: The Catalyst + Selloff
Our catalyst is when the 8-week MA crosses below the 18-week MA (highlighted by the green arrows on the chart).
The 1st catalyst which happened the week of May 8 2000 turned out to be a false positive. Although the Nasdaq experienced a few week sell-off, the price recovered soon after.
The 2nd catalyst which happened the week of July 31 2000 also turned out to be a false positive.
The 3rd time however was the charm. The catalyst during the week of September 25 2000 began one of the worst bear markets in history.
Result: Nasdaq fell ~70% over the next 12 months.

Timing is clearly essential for successfully betting on the downside.
And as we know, market timing is notoriously hard, and (very) easy to get wrong.
So it comes as no surprise that our catalysts can have some false positives.
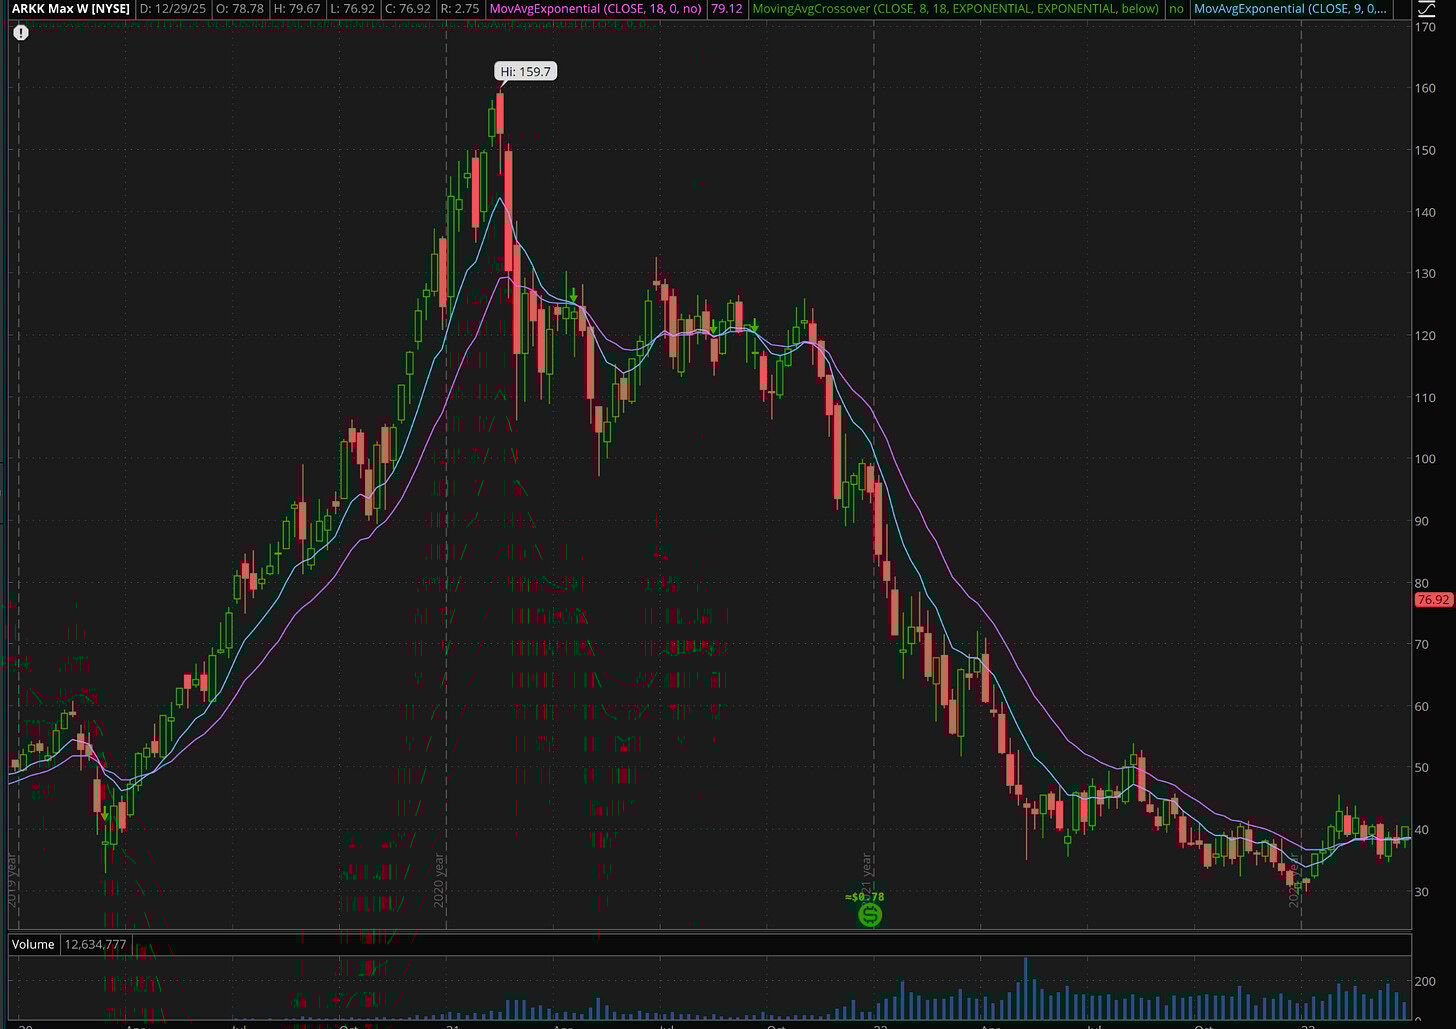
Example 2: ARKK 2021 Top
Phase 1: The Parabolic Advance
This one’s fresh. You probably remember it.
After COVID lows, ARKK surged nearly 5X in under a year.
Cathie Wood became a household name.
Phase 2: The Top
First weekly close below the 18-week MA: Week of March 1, 2021
Actual top: Two weeks earlier.
Phase 3: The Recovery
ARKK bounced from ~$106 to ~$131 in a matter of weeks.
Phase 4: The Catalyst + Selloff
Our 8-week/18-week MA crossover triggered three times:
Week of April 19, 2021: False positive
Week of August 16, 2021: False positive
Week of September 20, 2021: Finally, the catalyst that worked.
Result: ARKK fell ~75% over the next 15 months.
Example 3: Silver 1980 Top
Phase 1: The Parabolic Advance
Silver went up 9X in just 12-13 months!
Phase 2: The Top
First close below 18-week MA: Week of March 10 1980
Actual top: January 1980 (2 months earlier)
Phase 3: The Recovery
Here’s what made Silver 1980 different: there was no “gentle” recovery phase.
Unlike Nasdaq and ARKK, Silver didn’t recover immediately. Instead it first crashed nearly 80% first (from ~$50 down to $11), then recovered over the following 4 months, topping around $24 in September 1980.
That said, our 4-phase pattern still held: just with more violence on the way down.
Phase 4: The Catalyst + Selloff
First Trigger: Week of March 31, 1980
A sharp 43% drop followed: $19.05 down to $10.90
This would have been a tough one to bet on.
The market was clearly very oversold, and a “recovery phase” hadn’t happened yet.
Second Trigger: Week of December 8 1980 (after a 100%+ recovery)
This was it, the beginning of the end of one of the most spectacular commodity runs in history.
Result: Silver fell ~70% over the next 18-19 months.

Example 4: The Gold 1980 Top
Phase 1: The Parabolic Advance
Similar to Silver, Gold also experienced a parabolic advance that ended in January 1980.
Phase 2: The Top
First close below 18-week MA: Week of March 10 1980
Actual top: January 1980 (2 months earlier)
Phase 3: The Recovery
Gold’s drawdown was not as severe as Silver’s.
The low ended up coming the week of March 17 followed by a strong recovery over the next 8-9 months.
Phase 4: Catalyst + Selloff
The 1st catalyst, a false positive, came the week of April 14, 1980.
The 2nd catalyst triggered the week of November 17, 1980. This turned out to be the one that preceded the prolonged selloff.
Result: Gold fell ~53% over the next 18-19 months.

Example 5: Tesla 2021 Top
Phase 1: The Parabolic Advance
The stock surged from ~$12 in June 2019 to a whopping ~$415 in November 2021.
Phase 2: The Top
This is where things got tricky.
Tesla had multiple false tops.
False Top #1:
Close below 18-week MA: Week of March 9 2020
Top: February 2020
Top negated: June 2020
The parabolic advance continued
False Top #2:
Close below 18-week MA: Week of February 22 2021
Top: January 2021
Top negated: October 2021
The parabolic advance continued once again
The Real Top (November 2021):
Close below 18-week MA: Week of January 17 2022
Finally, the November 2021 top held.
Phase 3: The Recovery
Not much of a recovery…it lasted just ~2 weeks before the first catalyst.
Phase 4: Catalyst + Selloff
First catalyst (February 2022): False positive
Second catalyst (May 2022): Possible entry
Third catalyst (October 2022): Another entry
Result: Tesla fell 50-60% over 2-7 months depending on your entry.

Example 6: Micro-Strategy 2024 Top
Phase 1: The Parabolic Advance
From $14/share (January 2023) to $543 (November 2024)
Nearly 40X in under two years!
Phase 2: The Top
Like Tesla, MSTR experienced false tops.
November 2024 marked the final top.
The weekly close below the 18-week MA happened the week of February 17 2025.
Phase 3 & 4: The Recovery + Catalyst + Selloff
The 1st catalyst came the week of March 17 2025.
But it was a false positive, and the recovery continued until the week of July 14 2025.
The 2nd catalyst came the week of Aug 25 2025, and turned out to be the one that preceded the prolonged selloff.
Result: So far, MSTR has fallen ~55% over the past 4 months.

Example 7: Platinum 2008 Top
Phase 1: The Parabolic Advance
We can see the obvious parabolic advance that topped in 2008.
Phase 2: The Top
The stock closed below the 18-week moving average in:
April 2004: That top was later negated.
June 2006: That top was also negated.
March 2008: This was the real top.
Again, the advance experienced multiple false tops.
This lasted a brutally long time. Multiple years.
Phase 3 & 4: The Recovery + Catalyst + Selloff
There was not much of a recovery after the real top.
The catalyst came just a week after the weekly close below the 18-week MA, and the price of Platinum plummeted right away, for the next 3-4 months.
Result: Platinum fell ~60% over the next 4 months.

Example 8: Silver 1974 (Failed Pattern)
Phase 1: The Parabolic Advance
Silver went from ~1.282 all the way to $6.44 between November 1971 and February 1974.
Phase 2 & 3 & 4: The Top + Recovery + Catalyst + Selloff
Silver did top in February 1974 and our model would have caught it.
But the prolonged selloff never came.
Instead what we got was one false catalyst after another for 5 years!
At this time, the previous top was finally negated.
Betting on a selloff (using the method described above) after the 1974 top would have been a disastrous struggle.
Result: Sometimes things don’t go as planned.

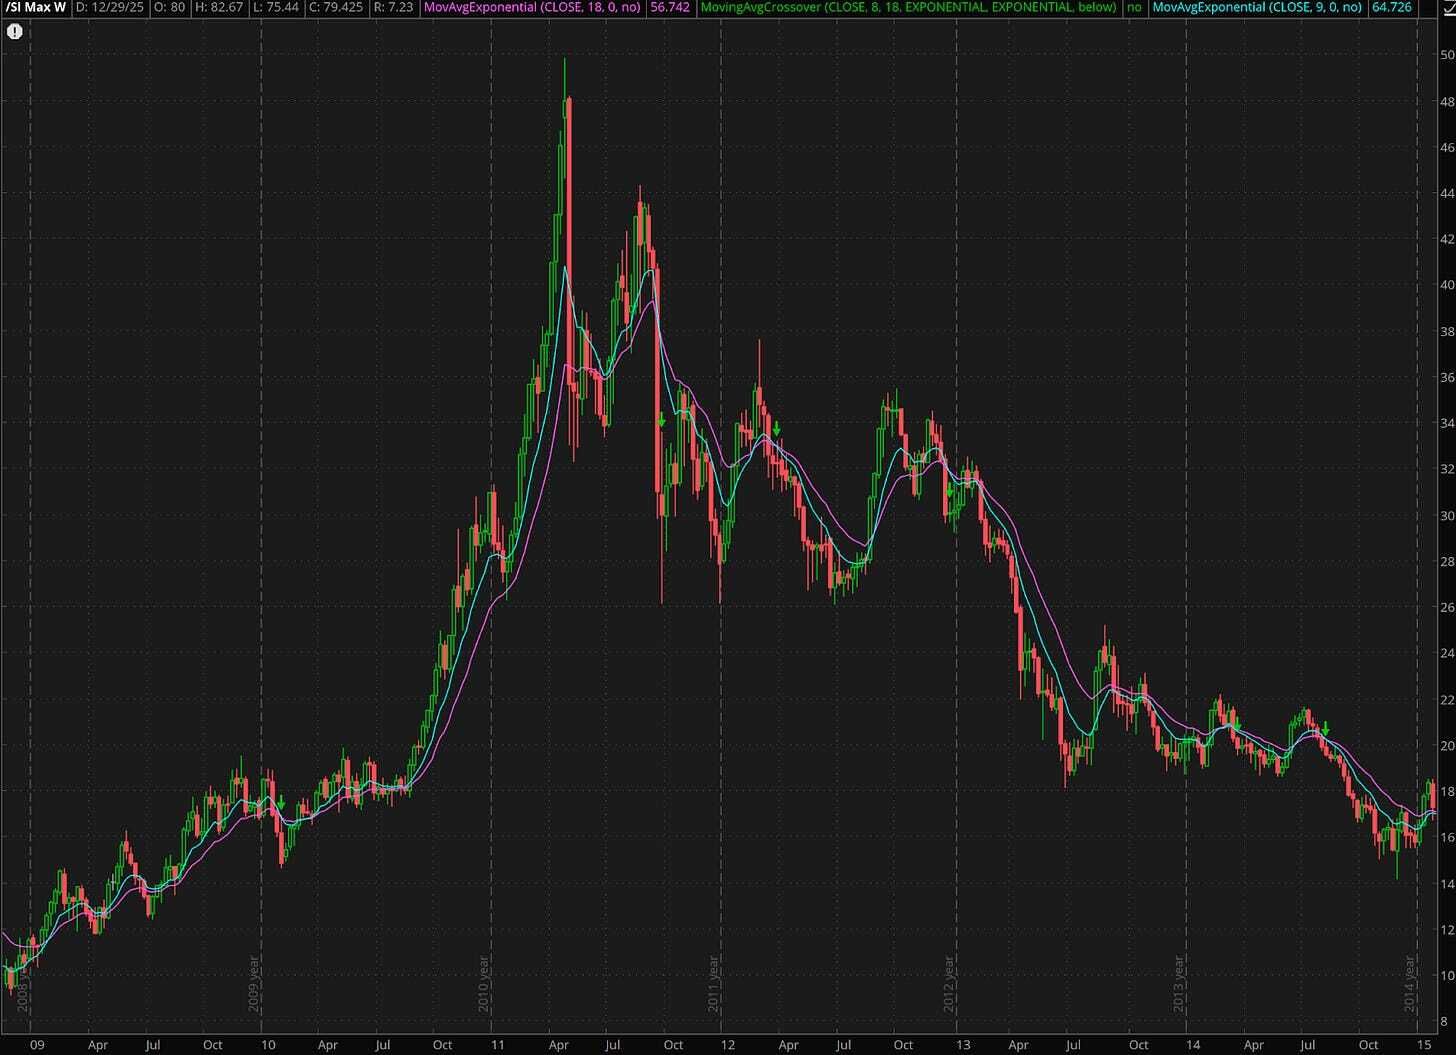
Example 9: The Silver 2011 Top
Phase 1: The Parabolic Advance
Silver went from ~8.5 up to ~50 in about 2.5 years, topping in 4/2011.
During the last 8 months of this run, Silver went from ~18 up to ~50.
Clearly a parabolic move.
Phase 2: The Top
Close below 18-week MA: May 2011
Top: April 2011 (~$50)
Phase 3: The Recovery
Recovery last ~4 months, and price rallied all the way back up to ~$44
Phase 4: Catalyst + Selloff
1st Catalyst: September 2011 (False positive)
2nd Catalyst: March 2012 (Another False positive)
December 24, 2012: After more than 18 months, the third trigger finally worked.
Result: Silver fell ~50% over the next 2 years.
Example 10: Amazon 1999 Top
Phase 1: The Parabolic Advance
Amazon went from a low of $0.07 (split adjusted) in 1997 to a whopping $5.6/share in December 1999.
If you’re counting, that’s about an 80-bagger in just 2 years!
A side note:
Amazon started becoming extremely volatile in early 1999:
The stock dropped from almost $5 to $2.12 in less than 2 months to start the year.
Then surged all the way back up to $5.50 over the next 3 months.
Over the next 4 months, it was a $2.07 stock.
Four months later, it once again surpassed $5.5/share.
Talk about volatility.
When volatility expands like this, the top might be close.
Phase 2 & 3: The Top + Recovery
First attempt:
Close below 18-week MA: Week of August 31 1998
But the stock resumed its parabolic advance and invalided the previous top.
Second attempt:
The week of Feb 15 1999, the stock dipped below the 18-week moving average once again. But didn’t close below it.
Third attempt:
The week of May 3 1999, the stock closed below the 18-week moving average once again.
It looked like Amazon had topped in April 1999.
The recovery happened over the next several months until January 2000.
The recovery however ended up making a new high (by just a little bit) of $5.65/share, compared to the previous high of $5.53/share.
Phase 4: Catalyst + Selloff
It might not seem like much, but one could have easily thought the previous top had been negated when this new high took place.
So there are 2 interpretations here:
Assuming April 1999 Top:
The 1st catalyst came the week of June 7 1999 (a false positive).
The 2nd catalyst came the week of Jan 17 2000. And this turned out to be the catalyst that preceded the prolonged selloff.
Assuming December 1999 Top:
Top: $5.65/share, week of 12/6/1999.
Close below 18-week moving avg: Week of 12/27/1999.
Recovery: Just the first few days in 2000.
Catalyst + Selloff: Week of Jan 17 2000.
Result: Amazon fell ~90% over the next ~20 months.

What These Examples Teach Us
After analyzing many, many, major parabolic tops spanning 50+ years, the core four-phase pattern remains remarkably consistent:
Parabolic advance
The top (confirmed by weekly close below 18-week MA)
Temporary recovery (the entry opportunity)
Catalyst triggers prolonged selloff (8-week crosses below 18-week)
During recovery phases, watch for:
Price appreciation on low/mediocre volume ⇒ May indicate weak demand
“Churning” (high volume, no price progress) ⇒ May indicate sellers in control
Expanded volatility ⇒ May indicate top may be imminent
For catalyst confirmation:
Not uncommon for first crossover to often be a false positive
Second / Third crossovers have better odds
Not uncommon to wait 6+ months for the real catalyst
The Limitations of Models
This framework is a simplified model of reality.
Models are only as good as their rules, and rules are based on historical patterns.
The main disadvantage? Simulations aren’t the real thing.
When real money is on the line, panic sets in, and fear can distort decision-making.
What looked like a “clear signal” in backtesting can become terrifying in real-time.
The good news is, the four-phase pattern has held across:
Different asset classes
Different time periods
Different market regimes (inflationary, deflationary, tech bubbles, commodity supercycles)
This isn’t a perfect system.
But it’s a pretty good framework.
Help Me Stress-Test This Framework
I’ve shared 10 examples where this pattern largely held.
But I want to know where it breaks.
Send me other parabolic tops.
I’ll analyze them and either:
Refine the framework to account for them, or
Identify the specific market conditions where this approach fails.
The goal isn’t to pretend this works 100% of the time.
It’s to understand when it works and when to stay away.
What’s Next: Placing Our Bets
We haven’t yet covered the most important part: how to structure our bets to actually profit from the post-parabolic selloffs.
Here’s what I’m working on for the next piece:
Shorting stock vs. buying puts
Systematic entry strategies
Managing false positives
Time horizon considerations
Position sizing
When to take profits and when to cut losses
If you’re serious about betting on parabolic reversals, subscribe so you don’t miss it!
If you liked this article, do please do share it with a friend. Thanks :)