- Playing For Doubles
- Posts
- How To Avoid The Next Stock Market Crash
How To Avoid The Next Stock Market Crash
Catastrophe Insurance
If you like this article, please share it with a friend & click the ❤️. Thanks!
If you’re new here, I share “buy-and-hold portfolios” that I think can double in 3-5 years. My investment philosophy is simple: Try to find the best stocks you can and let them sit for years. You incur no costs with such a portfolio, and it is simple to manage.
I wanted to revisit the indicator I had mentioned way back in September 2019:
To recap: Before major bear markets, the 9-month EMA crosses below the 21-month EMA, creating what traders call a “death cross.”
When the death cross happens, one can reduce exposure, hedge or completely move to cash.
I find this approach works best with an index, and it can be super helpful in avoiding a long extended bear market.
The indicator is simple, but the implications are profound.
Let me show you…
Historical Evidence
2001 Dot-Com Crash:
The crossover occurred in early 2001, several months before the worst of the decline. If you had exited when the signal triggered, you could have avoided the majority of a devastating 49% drawdown in the S&P 500 from peak to trough.
2008 Financial Crisis:
The death cross appeared in mid-2008. Selling at the crossover would have helped you sidestep most of a catastrophic 57% decline, one of the worst bear markets in modern history.
2022 Rate Hikes Bear Market:
In 2022, the market peaked in January 2022 at around 480. By the time the crossover signal triggered at the end of August 2022, SPY was trading around 400-410. This means the market had already declined approximately 17-20% by the time the signal appeared. The ultimate bottom came in mid-October 2022 at approximately 362, meaning the signal warned of an additional 10% decline from the point of the crossover.
How to Think About This Indicator
At the end of August 2022, when the signal triggered at 400-410, could you have known whether we were:
Near the end of a -25% correction (which is what happened)?
OR at the beginning of something more ominous (like 2001/2008)?
You couldn’t.
And that’s exactly why the signal matters.
It identified that the intermediate-term trend had turned decisively negative.
What the signal cannot tell you is the severity of what’s coming.
If you had followed this signal in 2022, you would have:
Exited at the end of August at ~400-410
Avoided the final capitulation drop to 362 (another ~10%)
Preserved capital during extreme volatility and uncertainty
But here’s the real value proposition: What if 2022 had turned into another 2008?
Instead of bottoming at 362 (a total -25% decline), imagine the market had continued falling. The signal would have gotten you out, potentially saving you from a much steeper decline, and years of recovery time.
This is the insurance value of the signal.
It is catastrophe insurance.
It’s like homeowners insurance: Most years, you pay premiums and nothing bad happens. You might feel like you “wasted” money. But the one year your house burns down, that insurance saves you from financial ruin.
Similarly, this indicator will take you out of the market after you’ve already sustained losses. But the one time it saves you from watching your portfolio get cut in half (like 2001 or 2008), it preserves decades of wealth accumulation.
You don’t complain that your homeowners insurance was “unnecessary” because your house didn’t burn down.
You’re glad you had it just in case.
Practical Implementation
If you decide to monitor this crossover, here’s how to use it.
Monthly Monitoring:
Check the indicator at month-end only.
Daily or weekly fluctuations tend to be noisy.
Sell Signal:
When the 9-month EMA crosses below the 21-month EMA → Reduce equity exposure, hedge or move to cash.
Buy Signal:
The indicator can also be used as a buy-signal.
When the 9-month EMA crosses back above the 21-month EMA → Increase exposure.
In 2022-2023, you would have sat out from August 2022 to March/April 2023, about 7-8 months. You must have the discipline to wait for the signal.
Acknowledge You’ll Lock in Losses:
Understand that by the time the signal triggers, you’ll likely already be down from the peak. That’s the nature of lagging indicators. The question isn’t whether you avoid all losses, but whether you avoid catastrophic losses.
Most Importantly, Pick The Right Proxy:
We see that in 2022, the SPY triggered a sell signal at the end of August 2022.
Teal line: 9-month EMA
Purple line: 21-month EMA
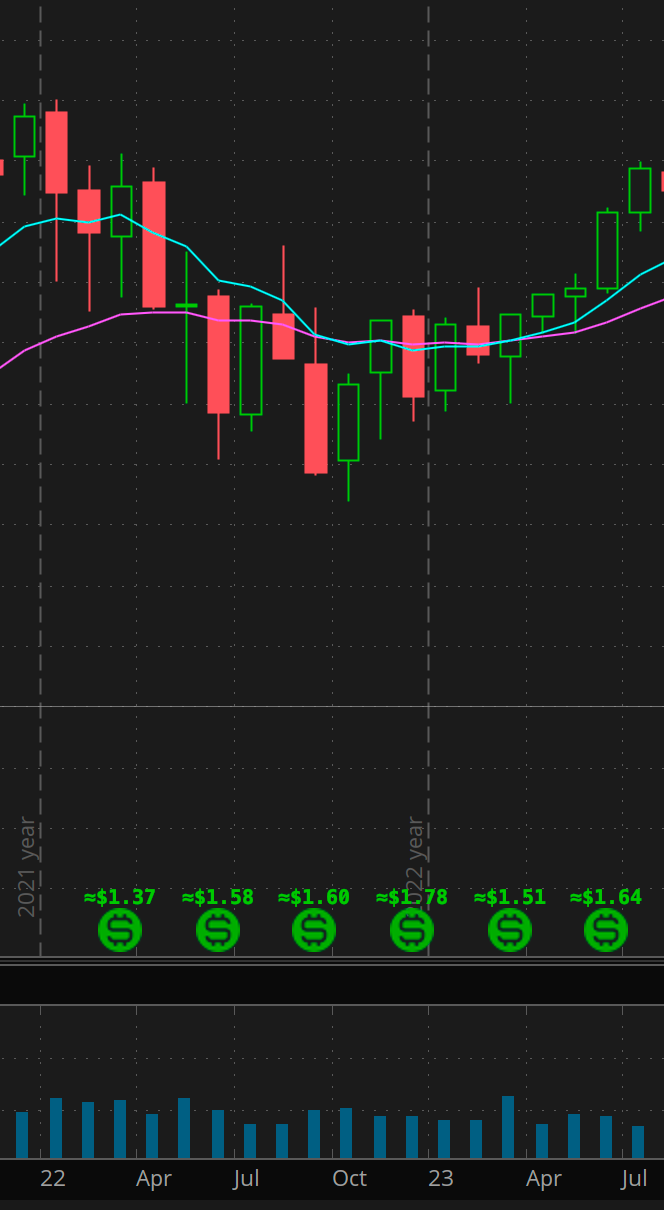
The August sell-signal on SPY would however have been too late for a portfolio that primarily consisted of high growth tech stocks.
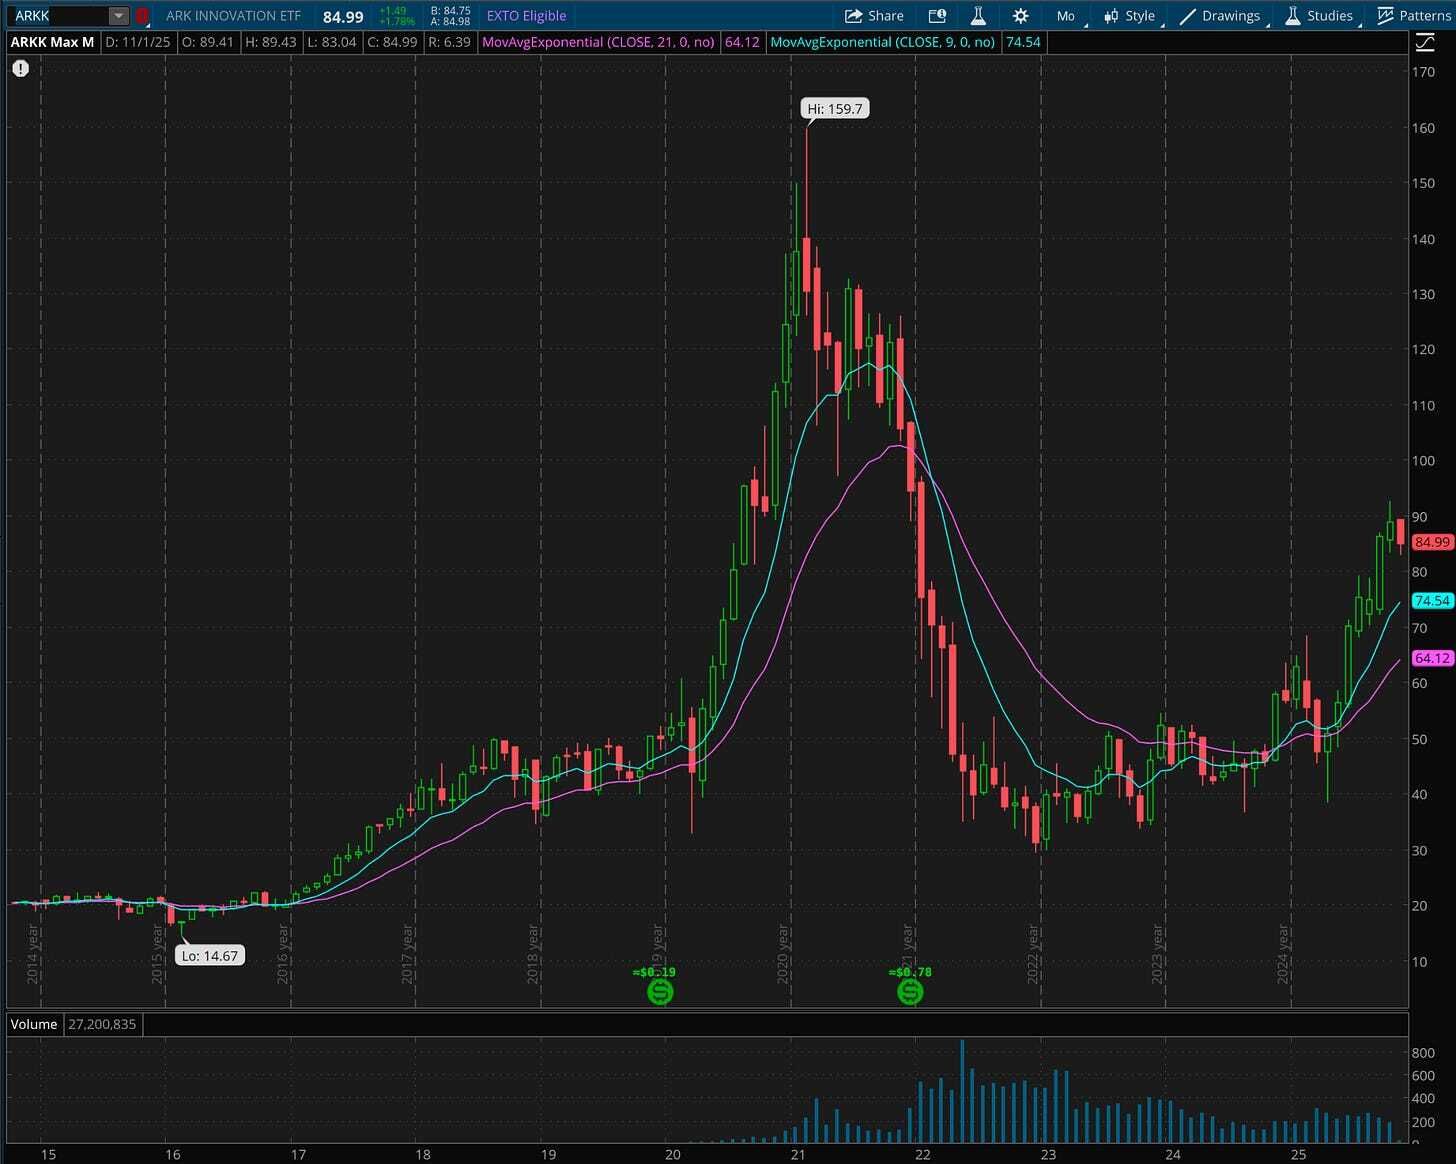
In 2022, for a portfolio of high growth tech stocks, $ARKK would have been a better proxy.
For $ARKK, the “sell-signal” triggered much earlier than $SPY’s, in Jan/Feb 2022 around $75-$85/share.
Moving to cash at that time would have avoided a massive 60% drawdown from Feb/Mar 2022 to Dec 2022. That’s the power of the 9/21-month EMA crossover.
As you can see, the composition of your portfolio will determine which index you monitor.
So, What’s The Conclusion?
This 9/21-month EMA crossover indicator offers a systematic way to sidestep potential catastrophic declines.
Will it take you out after you’ve already experienced losses? Yes.
But will it save you from financial devastation in the next true crash? Probably.
The indicator isn’t about perfection or catching exact tops and bottoms. It’s about risk management and catastrophe avoidance. It’s about sleeping soundly knowing you have a systematic rule to protect you from the big one.
Today, the indicator shows clear skies ahead.
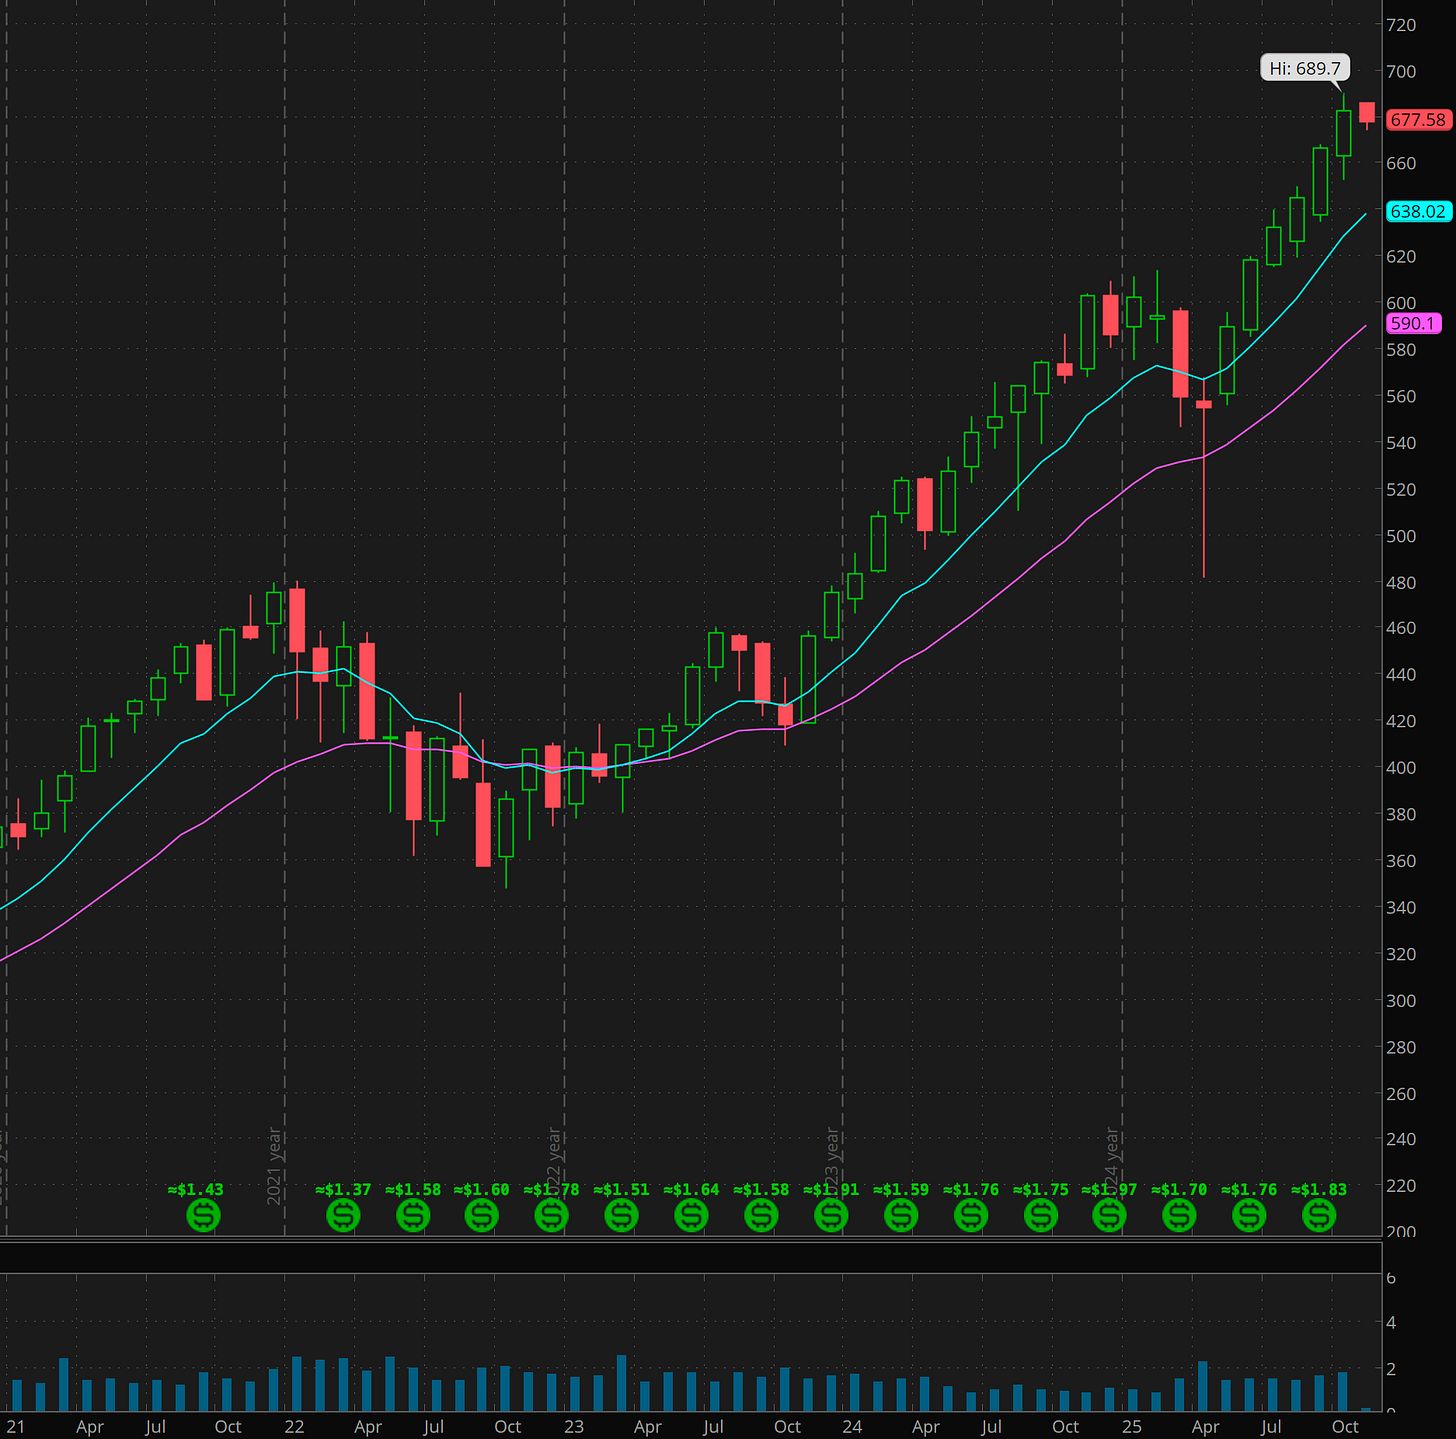
But I’ll continue monitoring it monthly, and I suggest you do the same.
When the lines start converging, pay attention.
When they cross, take it very seriously.
Caveat
Like any indicator, it may not work all the time.
The indicator likely won’t work great if the market experiences a very fast crash.
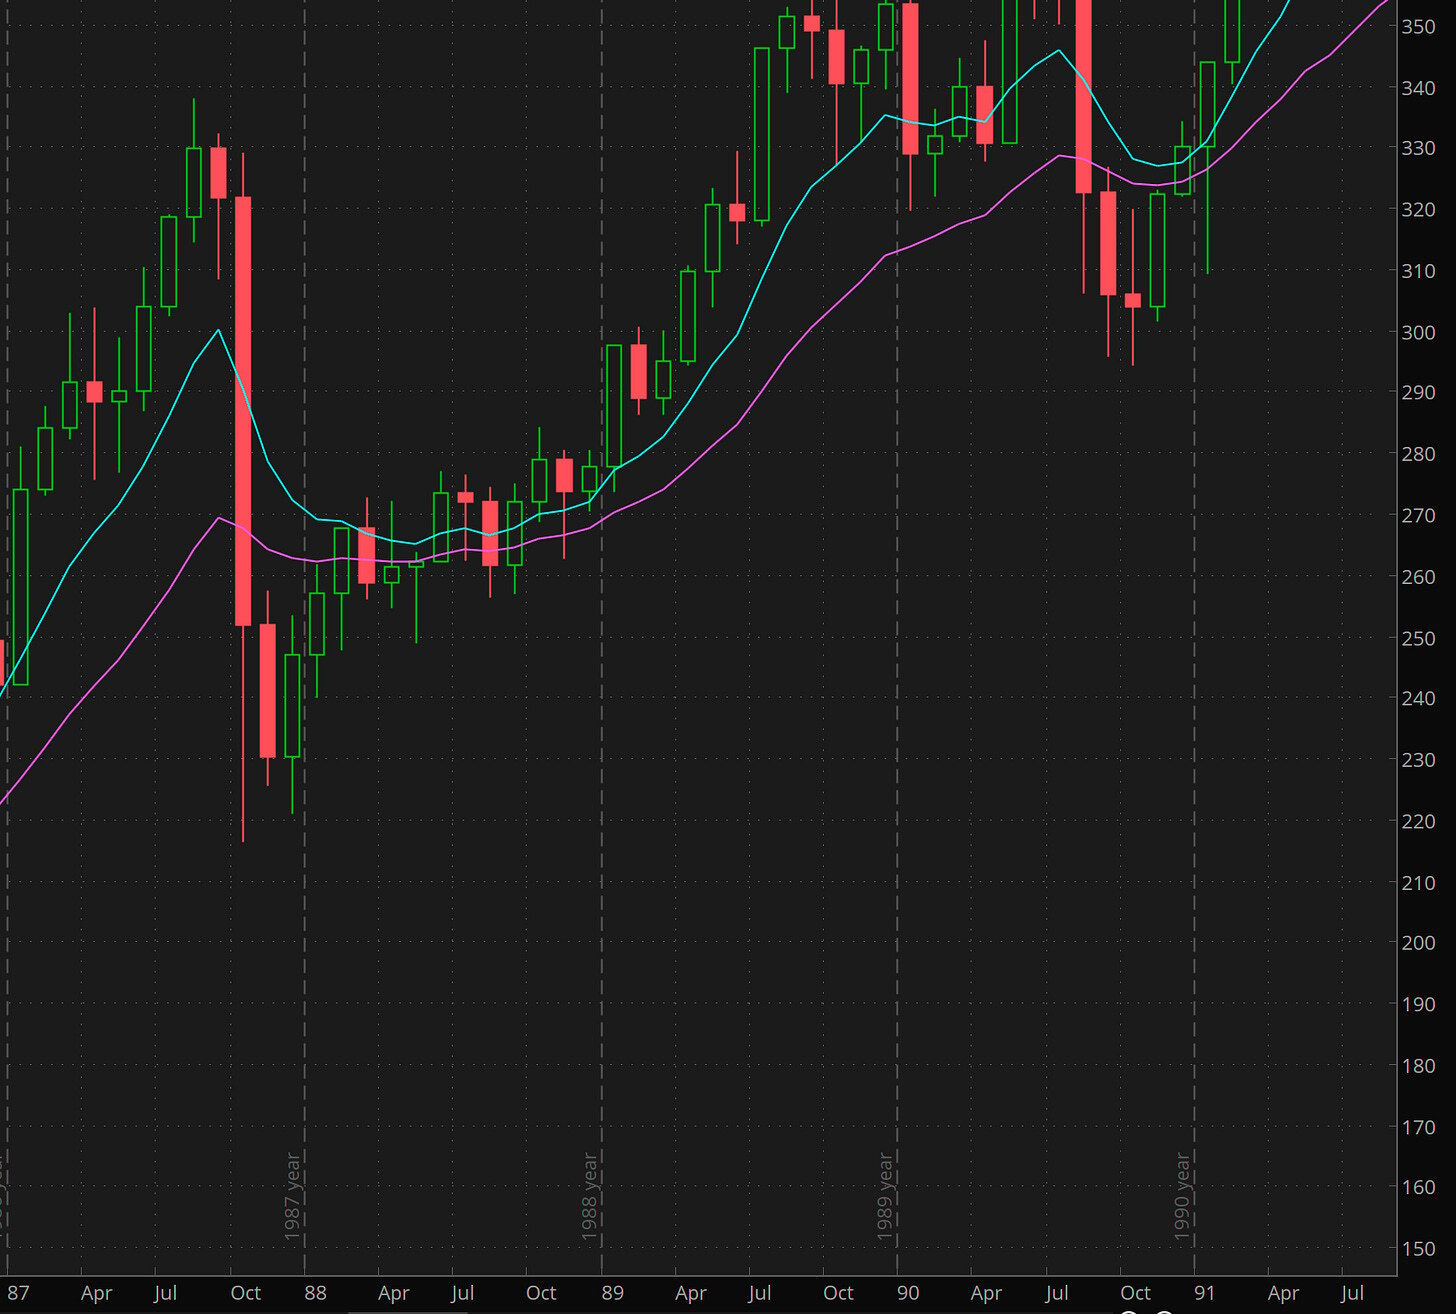
Notice how the indicator would not have triggered during the 1987 Black Monday crash. The teal line didn’t cross below the purple line (see below).
In this case, the max drawdown would have been about ~35%.
